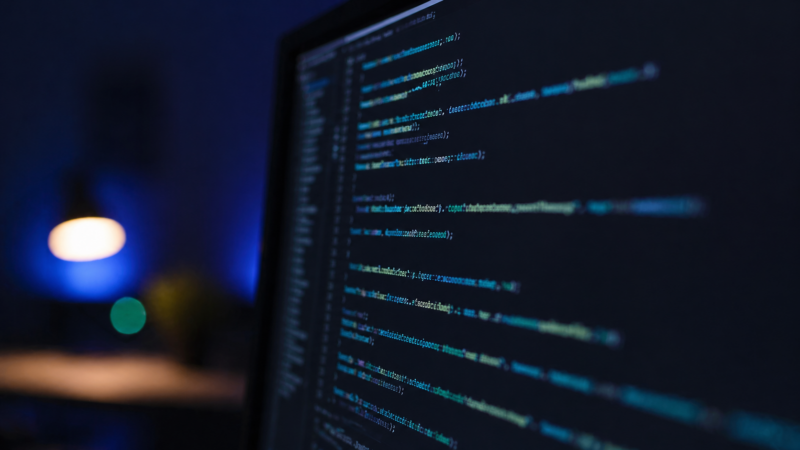
Bringing Runtime Trace Analysis Directly into Your Development Environment
Understanding what happens inside an embedded system at runtime has always required switching between tools — breaking the development flow and adding time to the debugging process. Our partner Percepio addresses this with the new TraceExporter extension for VS Code, integrating trace capture directly into the IDE most developers already use.
Seamless trace capture during debug sessions
The TraceExporter extension connects Percepio TraceRecorder with VS Code's GDB-based debug environment. During an active debug session, developers can capture a snapshot of the system's runtime behavior with a single click and open it directly in Percepio Tracealyzer — without leaving the development environment. This removes the need to manually export, locate, and import trace files between separate tools.
The extension is compatible with widely used RTOS environments, including Zephyr, FreeRTOS, SafeRTOS, ThreadX, Cesium, and PX5, as well as TraceRecorder's Bare Metal option. Initial testing has been carried out with Nordic nRF Connect for VS Code, but the extension is designed to work across most GCC-based VS Code setups.
Why this matters for embedded development
Debugging timing issues, race conditions, and unexpected runtime behavior in embedded systems is inherently complex. Having trace data available in the same environment where code is written and tested reduces context switching and allows development teams to correlate observed behavior with the relevant source code more efficiently.
By keeping trace analysis within the standard development workflow, teams can iterate faster and address issues earlier in the development process — before they become harder and more costly to resolve.
Getting started
The extension is currently available as a Beta release in .vsix format and can be installed directly through the VS Code Extensions panel. Once configured with the path to Tracealyzer, capturing and visualizing runtime traces becomes a straightforward step in the debug workflow.
For teams already using Percepio Tracealyzer, the TraceExporter extension is a practical step toward a more integrated and efficient embedded development process.