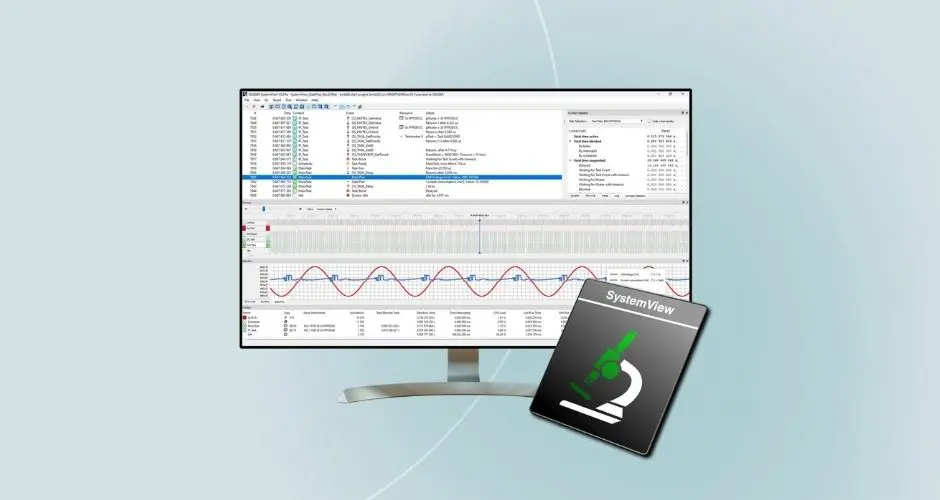
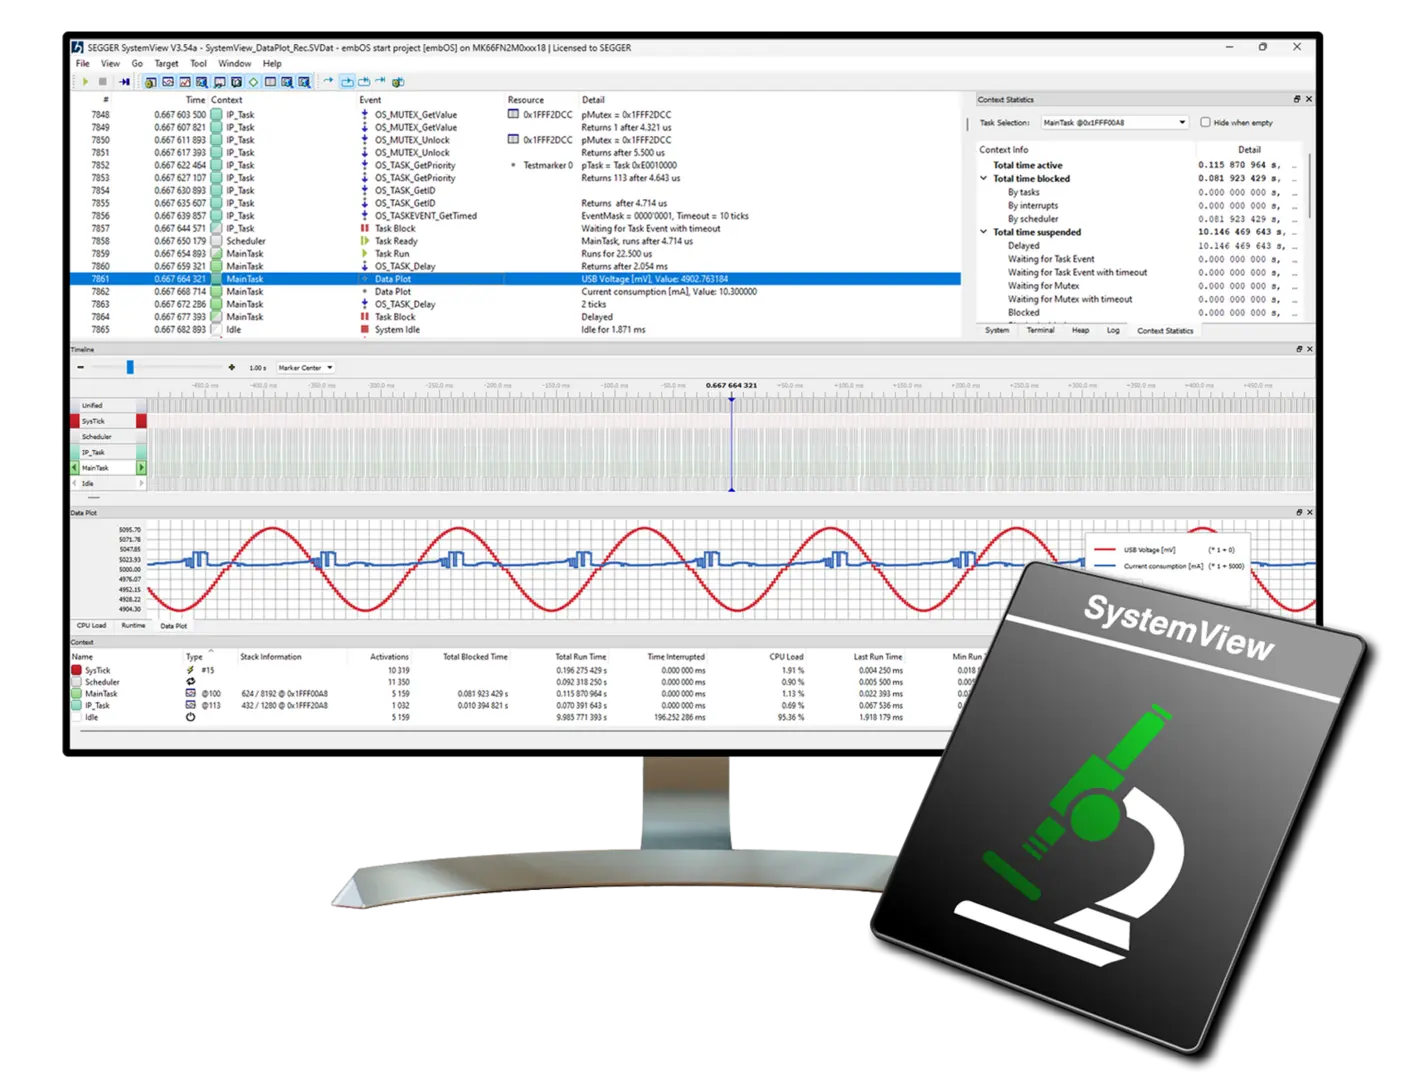
SystemView
SEGGER's SystemView is a powerful trace-analysis tool for verifying and validating embedded systems. Designed for embedded software testing, it records, analyzes, and visualizes captured data in real time; documents tasks, interrupts, and user events; and much more.
Our brands
Our brands
Related articles
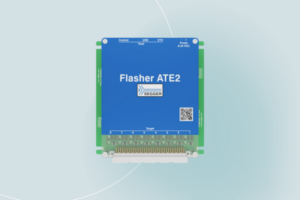
SEGGER announces new, competitively priced 4-channel Flasher ATE2
Our partner SEGGER has expanded its gang programming portfolio with the Flasher ATE2 (4-channel), a new entry-level single-board in-system programmer. This 4-channel variant is designed to reduce the initial investment...
Read more
SEGGER Flasher BitStreamer Brings Universal FPGA Programming to In-System Flashers
Read more
PRESS RELEASE – McObject Launches eXtremeDB/rt 2.0: Breakthrough Persistent Hard Real-Time Database System Now Available to Logic Technology Clients
Read more
New partner product: SEGGER – USB Hub-13
Read more
PRESS RELEASE – Logic Technology becomes exclusive Benelux distributor for IAR
Read more

Gevorg Melikdjanjan
Security | Reliability | Data Solutions
Curious how SystemView fits into your embedded workflow?
I am here to help you with your embedded setup. Let’s make SystemView work seamlessly in your development environment.